Recently, I overheard a toddler asking his mother “why?” multiple times while she patiently answered. It went on and on for several minutes, with the mother having to pause several times as she thought of the answers. Then he finally said, “Okay,” and was satisfied with the answer.
How many of you have experienced this? Whether with your own kids, nieces or nephews, it can be interesting to navigate the potential minefield of answers based on the originating question.
Call me an ERM geek. That is what I am…because it occurred to me that toddlers instinctively know how to do a root cause analysis.
How crazy is that?
It’s inherent in our nature to want to “get to the bottom” of things. The good news is that this type of review can be extremely beneficial to our businesses.
Root Cause Analysis – The Basics
What is a root cause analysis? It’s exactly what it sounds like—an exercise to determine the root cause for a failure or issue, so that the solution is based on the true problem, not just addressing the symptoms.
Root cause analysis (RCA) is discussed as a potential method for risk identification in my free eBook 5 Effective Methods of Risk Identification for Your Organization. But it’s not just a risk management tool; it is also a helpful general business tool for decision-making and process improvement.
Who can use root cause analysis? Any type of organization, regardless of industry, can use it.
How is it done? Well, this answer can get tricky, because there are multiple ways of conducting root cause analysis, and some of them can be used in combination.
- Brainstorming
- Flowcharting
- 5 Whys
- Fishbone diagrams
- Affinity Diagrams
Let’s review some of these in more detail and see how they can be helpful for ERM professionals.
1. Brainstorming
 Brainstorming is one of my favorite ways of starting off with the root cause analysis. Notice I said “start” because the reality is that the best analysis is conducted by using a combination of these methods.
First, you are need to get the right subject matter experts together in the room or, for those organizations spread out geographically, on a call (I personally prefer video conferences over audio only).
It’s best to have a designated facilitator. This is where I recommend ERM assist, especially if your organization has a healthy (a.k.a. positive) risk culture. The facilitator can keep the conversation from going into rabbit holes that do not benefit the organization, while also ensuring that the information is being captured appropriately.
There are several ways to capture the content of the discussions, but selecting the right method should be based on the people in the room and their personalities, if everyone is the same room, and amount and kind of information.
My two preferred methods of data capture are using sticky notes and writing on a whiteboard. And it never hurts to have someone taking electronic notes to gather context if everyone else is in agreement.
The sticky notes are helpful when:
- Collecting ideas from the group when people may feel uncomfortable speaking up.
- Giving the attendees 1 minute to write down their thoughts/ideas without having them influence one another.
And the whiteboard is useful for capturing rapid-fire comments and observations during an open conversation.
Due to the amount of time that these conversations can take, there should only be one or two topics of conversation. Otherwise, people will get talked out, distracted, and lose attention.
2. Flowcharting
A natural companion to brainstorming is flowcharting, especially if you have a whiteboard to use and capture the conversation.
Flowcharting is extremely helpful when there are multiple paths for a conversation to follow to identify the root cause. In fact, you may be familiar with specific types of flow charts, like work flow diagrams or process maps.
For a visual example of a flowchart, think about data flow charts developed when software is being designed.
Check out this Wikipedia article on flowcharts if you’d like more detailed information.
3. 5 Whys
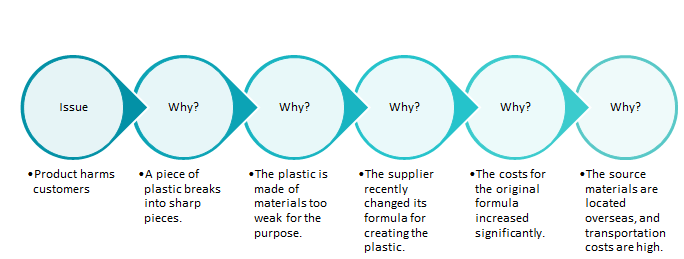
The simplest way to describe this method is literally asking “why?” to reach the root cause. Let’s face it – if it takes more than 5 whys to uncover the root cause, there are bigger problems that need to be challenged.
Below is an example for how the 5 Whys could be used. It can be as simple as a one-on-one conversation or as complicated as a large group discussion, depending on the subject matter and how many people are needed.
4. Fishbone diagrams
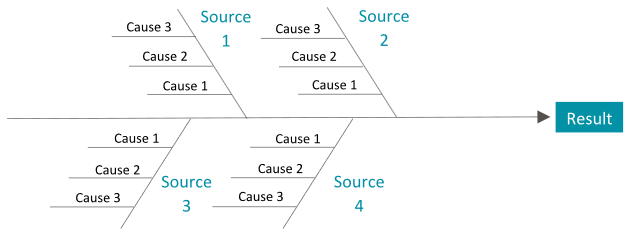
Fishbone diagrams are a good visual tool to help understand an issue by identifying multiple potential causes. The same question—“Why?”—would be asked, but not to the depth of the 5 Whys method. The fishbone diagram method is also based on the assumption that multiple potential causes.
The diagrams can be as simple or as complex as you need them to be.
A simple fishbone diagram can look like this:
While a more complex fishbone diagram can look like this, which groups the causes into areas of the source, such as training, machinery, people and suppliers:
Don’t feel pressured to electronically create something like this on the fly. Instead, use a whiteboard during the conversation to capture the information quickly to keep the discussion flowing.
5. Affinity Diagrams
Essentially, affinity diagrams group similar or related ideas, notes, and suggestions and are a natural companion to brainstorming, especially since one of my favorite data capture methods is using sticky notes.
A group of related sticky notes on a whiteboard can be considered an affinity diagram, especially if you take pictures of the grouped notes for later reference. In fact, if you have an iPhone, 3M has released an iOS app that takes pictures of groups of sticky notes, analyzes the individual notes, and organizes them so you can share them with meeting participants.
Combining methods is most effective
The easiest way to demonstrate why using a combination of these methods for root cause analysis is to walk through an example.
You want to determine why sales of a specific product are not reaching the projected levels. The best way to get input on this topic is to conduct a brainstorming session with people from manufacturing, vendor management, marketing, sales, customer service, and shipping.
As you collect their ideas on the whiteboard, three specific causes are identified that could contribute to lower sales: the packaging isn’t attracting customers, feedback and reviews from customers are not positive, and shipping costs are eating into revenue.
Now that those three areas are identified as specific causes, solutions need to be created. You as facilitator ask the participants to use their sticky notes to write down their ideas for how to improve the current situation. After a minute or two, you collect all of their notes and group them under the relevant cause on the whiteboard for all to see.
By doing this, you have used 3 methods: brainstorming, fishbone diagram, and affinity diagram. And now you have a bunch of ideas for solving the problem of low product sales.
Which root cause analysis method is your favorite? How have you used root cause analysis?
Please comment below or join the conversation on LinkedIn.
If your ERM program is stuck in neutral and needs a boost to get moving again, contact me for specific guidance on developing a tailored action plan to achieve your ERM goals.


