Within the enterprise risk management (ERM) field, practitioners talk about using indicators to better understand when the environment, whether internal or external, is changing around a specific risk. Some company or industry-specific (i.e., micro) drivers of uncertainty like talent, technology advancements, or shifting consumer preferences are, with the right tools, relatively easy to understand and plan.
However, doing the same around broader, macro-economic trends and sources of uncertainty can be a bit more challenging. As we discussed in a previous article exploring the broader economy, robust ERM practices can help an organization understand how a downturn will affect them and take proactive steps to prepare, and possibly benefit, over competitors who simply react in the moment.
This is not too dissimilar to how inflation impacts a company’s strategic goals.
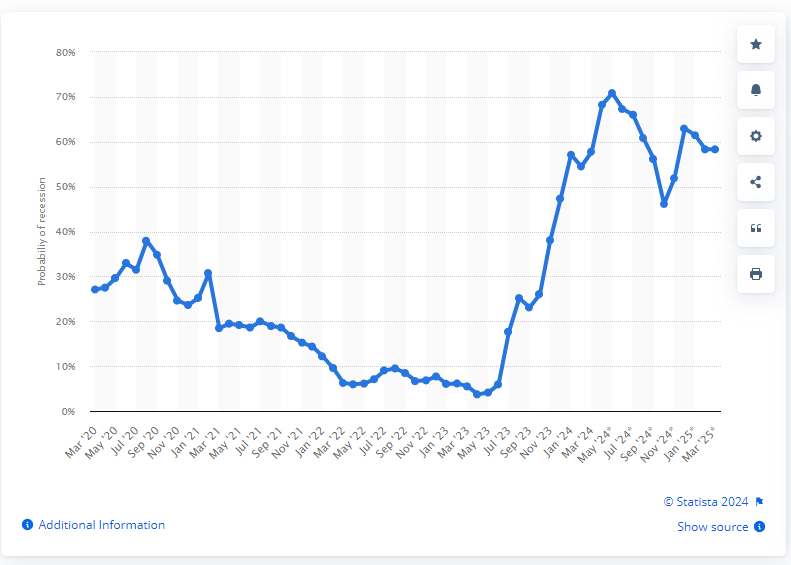
This topic is especially relevant right now since, according to the following chart from Statista, the probability of the economy entering recession in the next year is much higher than it was in 2023.

It’s clear, even to passive observers, that the economy goes through booms and subsequent busts, panics, or the more commonly used word, recessions. It’s always easier to see the boom and bust in the business cycle in hindsight. Most reading this article probably remember the last prolonged “bust” and subsequent recession that occurred between 2007 and 2009.
Knowing when a downturn is happening, much less why, is a much bigger mystery that very few understand.
Therefore, a company needs leading indicators to know when this emerging risk is materializing. Using key risk indicators to get ahead of a downturn or “recession” can be invaluable in preserving and creating value in an otherwise chaotic situation.
Fortunately, retired economics professor Dr. Murray Sabrin provides some examples of leading indicators or signposts in his book Navigating the Boom/Bust Cycle: An Entrepreneur’s Survival Guide. Many companies fail to see these signs because as Dr. Sabrin explains:
“When the economy is booming – or at least expanding at a moderate rate – and prosperity seems limitless, a recession seemingly comes out of ‘nowhere.’ Many (most?) business decision makers are caught completely off guard as the economy rolls over.”
Although a downturn can affect each company differently, watching the following indicators can provide ERM professionals and executive decision-makers with the opportunity to tailor strategic and operational plans to the business cycle to avoid surprises. Examining bigger picture issues like this is one way risk professionals can demonstrate value to CEOs and other leaders.
It’s important to note these signals could indicate a downturn is brewing, so I should caution you not to take one in isolation or look at news from only one source or industry and conclude that a broader recession is about to occur. This caution is why I’m not including any links to articles on current news on the economy, although there are plenty to choose from right now.
The 7 Macro Economy Indicators
With that said, specific indicators Dr. Sabrin cites in his book include:
1. Employment – during a boom phase, employment can skyrocket, especially in certain industries that are sensitive to interest rates like finance, real estate, and construction. However, as the peak of the boom phase gets closer, employment will begin to plateau. Industries that over-extended themselves during the boom will typically see wild swings in unemployment. If general unemployment is flat or starts rising sharply, it could indicate the beginning stages of a downturn.
2. Personal income – on the surface, it can be challenging to use personal income as a signal of an impending downturn. This is largely due to a long-term decline in real wages and the fact that personal income can include transfer payments in the form of unemployment, Social Security, and other government programs. Therefore, companies should be looking at numbers for industries that seem to be doing exceptionally well, like the dot-coms in the late ‘90s, the housing market in the 2000s, or anything to do with AI today. In the case of the dot-coms, individual compensation increased by 10% per year during the boom, but once the bust started happening, it dropped like a stone.
3. Profits – profits can fluctuate wildly for sectors, like real estate and utilities, that are sensitive to interest rates due to the amount of borrowing they do. As expected, during the boom phase, profits will typically go up because interest rates go down, which means borrowing gets less expensive. But as we saw in the lead up to the dot-com bust in 2000 and the housing bust in 2007, total corporate profits began to decline. Therefore, if profits begin to plateau and decline, especially in sectors that are sensitive to interest rate fluctuations, a recession may be in the making.
4. The Industrial Sector – the level of industrial production, or the output of industrial companies, will vary from one cycle to the next and between industries (e.g., mining, manufacturing, electricity, gas). During the housing boom in the early 2000s, industrial production rose sharply, and then peaked just when the Great Recession was getting underway. Consumer goods, the end result of production and manufacturing such as clothing, food, and appliances, also plummeted during this time, signaling just how deep the downturn was. Therefore, industrial production peaking in more “sensitive” industries like housing construction can act as a signal that a downturn is happening.
5. Retail sales – due to population growth, rising living standards, and growing access to credit, retail sales typically increase over time. In the middle of a boom phase, it can seem like sales really skyrocket. Once they start to slow and possibly decline, a recession could be brewing. This indicator can vary based on the conditions surrounding the downturn. Retail sales plunged dramatically during the 07-09 recession but actually increased in the short-lived 2020, pandemic-induced downturn – retail therapy (in my humble opinion). Also, this indicator depends on the type of retail sales since sales of beer, wine, tobacco, and other “sin” industries tend to be resilient in both good times and bad.
6. Stock market – since 1990, there have been two major “busts” in the stock market – one in 2000 related to the dot-com bubble and the other in late 2007 with the collapse of the housing market. In both cases, stock indices hit an all-time high and plateaued for several months before declining. One (closely watched by Warren Buffett) signal that a bull market is close to peaking is the relationship between corporate equities and gross domestic product (GDP). This indicator reached an all-time high just as the dot-com bubble was peaking in 2000. Conversely, this indicator hit bottom in 1982, which coincides with the beginning of a bull run that lasted for nearly 20 years.
7. Inverted yield curve – if a company is not watching them closely, each of the preceding indicators don’t leave a whole lot of time to prepare. Once they become apparent, it is quite possible that a downturn is already underway. On the other hand, the yield curve, or the spread between short- and long-term U.S. Treasury securities, is a little different. When the yield curve inverts, or the short-term yield exceeds the long-term, a downturn is usually not too far away. When you look closely at the chart below, it is obvious the yield curve was inverted just before downturns in the early ‘90s, 2000, 2007-09, and even just before the short-lived, pandemic-induced downturn of 2020. (Really makes you think, huh?)
Image source: https://fred.stlouisfed.org/series/T10Y2Y
As mentioned earlier, these indicators are just examining the economy on a macro-level. Exactly how a broader downturn impacts your company will depend on a wide range of factors including industry, geography, market position, expense loads, and more.
Describing the emerging risk
A company cannot simply label an emerging risk like this as “economic environment” or “inflation.” There are so many moving parts, both inside your company and in the broader economy, you must be clear about to know exactly where the uncertainty is.
Without a clear risk statement on exactly what a risk like this entails, everyone in the company will struggle to understand what their next steps should be, if any.
An example of a clear if/then risk statement related to the economy could be:
“If the Fed interest rate continues in an upward trend, then sales volume could be negatively impacted due to consumers’ decreased ability to secure borrowing at acceptable interest rates.”
Of course, this topic shouldn’t be limited to “risks” in the negative sense.
Economic downturns are nothing new, and as was the case in previous eras, they can also be sources of great opportunity. After all, half of all Fortune 500 companies, including FedEx, UPS, Revlon, and others were created during the Great Depression.
Considering all the factors of geography, size, industry, sector, et al, it is impractical to provide guidance on how your company should handle a downturn. However, monitoring these different signposts can help your company take a more proactive approach to dealing with this recurring reality.
The one certainty in this otherwise very VUCA (volatile, uncertain, complex, and ambiguous) world is taking a reactive approach based on a scarcity mindset can end up creating even more problems, up to and including the business failing altogether.
How are you preparing your company for a change in the economy?
With increasing uncertainty and volatility around the economy, it’s important to stay on top of it so your company is not caught off guard. To share your thoughts, please feel free to join the conversation on LinkedIn.
If your company is struggling to build resilience around this and other potential hindrances, contact me to discuss your current situation and a path forward.


